
Page 5 - Work Force July-August 2020
P. 5
U.S. Census
response rates lag
from 2010 – still
time to respond
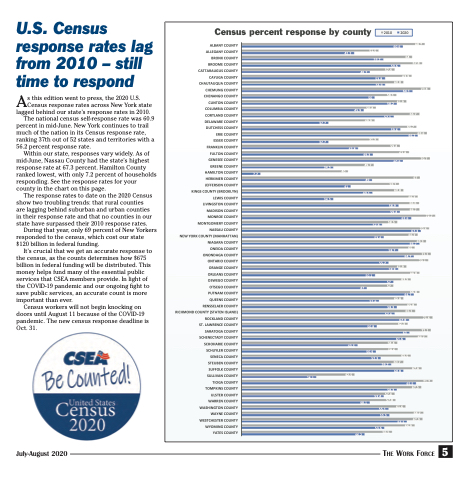
As this edition went to press, the 2020 U.S. Census response rates across New York state lagged behind our state’s response rates in 2010.
The national census self-response rate was 60.9 percent in mid-June. New York continues to trail much of the nation in its Census response rate, ranking 37th out of 52 states and territories with a 56.2 percent response rate.
Within our state, responses vary widely. As of mid-June, Nassau County had the state’s highest response rate at 67.3 percent. Hamilton County ranked lowest, with only 7.2 percent of households responding. See the response rates for your county in the chart on this page.
The response rates to date on the 2020 Census show two troubling trends: that rural counties are lagging behind suburban and urban counties in their response rate and that no counties in our state have surpassed their 2010 response rates.
During that year, only 69 percent of New Yorkers responded to the census, which cost our state $120 billion in federal funding.
It’s crucial that we get an accurate response to the census, as the counts determines how $675 billion in federal funding will be distributed. This money helps fund many of the essential public services that CSEA members provide. In light of the COVID-19 pandemic and our ongoing fight to save public services, an accurate count is more important than ever.
Census workers will not begin knocking on doors until August 11 because of the COVID-19 pandemic. The new census response deadline is Oct. 31.
NEW
ALBANY COUNTY
516.50.6
53.2 64
68.7
ALLEGANY COUNTY
42.2
51.5 53.2
64
BRONX COUNTY
BROOME COUNTY
48.2 59.6
67.8
60.8
61.9
DUTCHESS COUNTY
59.6 51.5 51.5
ERIE COUNTY
ESSEX COUNTY
59.4 60.6
FRANKLIN COUNTY
43.8
62.8
FULTON COUNTY
49.3 49.7
GENESEE COUNTY
GREENE COUNTY
40
NASSAU COUNTY
ALLEGANY COUNTY
42.2
NEW YORK COUNTY (MANHATTAN)
53.4
58.7 58.8
66.2 66.769.3
YORK COUNTY (MANHATTAN)
66.769.3 65
NIAGARA COUNTY
ONEIDA COUNTY
QUEENS COUNTY
60.8
58.3 57.4
50.8 62.8 62.3
RENSSELAER COUNTY
65.8
SARATOGA COUNTY
63 61.6
58.6
52.3 63.5
SCHENECTADYCOUNTY
BRONX COUNTY
BROOME COUNTY
59.6
CATTARAUGUS COUNTY
57.4
DUTCHESS COUNTY
ERIE COUNTY
ESSEX COUNTY
FRANKLIN COUNTY
43.8
59.4
49.3
49.7 60.6
49
59.1
FULTON COUNTY
62.8
GENESEE COUNTY
70.7 67
GREENE COUNTY
34.5
HAMILTON COUNTY
7.2
40
NASSAU COUNTY
NIAGARA COUNTY
COUNTY
50.1 47
51.6
50.8
43.5
50.4 52.3
42.5
48.1
46.2
63.5
RICHMOND COUNTY (STATEN ISLAND)
57.4
OND COUNTY (STATEN ISLAND)
65.1
ROCKLAND COUNTY
71.6
61.6 58.4 69.7
58.6
SAINT LAWRENCE COUNTY
ONEIDA COUNTY
58.7
65 64.7 71.1
ONONDAGA COUNTY
64.7 71.1 70.1
71.6
71.1 69.7
ONONDAGA ONTARIO ORANGE ORLEANS OSWEGO OTSEGO PUTNAM
RENSSELAER COUNTY
COUNTY
ONTARIO COUNTY
55.2
70.1
COUNTY
55.2
58.8 61.9
ORANGE COUNTY
61.9 63.557
COUNTY
66.8 57
66.8 64.7
65.8 65.1
62.3 63
ORLEANS COUNTY
50.1 47 57
66.8 66.8
OSWEGO COUNTY
COUNTY
OTSEGO COUNTY
57
COUNTY
PUTNAM COUNTY
COUNTY
64.7 60.8 58.3
QUEENS COUNTY
51.6
ROCKLAND COUNTY
62.8
ST. LAWRENCE COUNTY
SARATOGA COUNTY
71.1
SCHENECTADY COUNTY
SCHOHARIE COUNTY
43.5
SCHUYLER COUNTY
63.5 60.7
SENECA COUNTY
STEUBEN COUNTY
56.2
67.6
65.5 71.7
SUFFOLK COUNTY
67.6 65.5
SULLIVAN COUNTY
28.1
TOMPKINS COUNTY
67.5 58.3 53.4 57.4
ULSTER COUNTY
57.8
61.6 68.2
WARREN COUNTY
57.8 55.5
WASHINGTON COUNTY
55.1
SCHOHARIE COUNTY
58.4
TIOGA COUNTY
SCHUYLER COUNTY
50.4
SENECA COUNTY
STEUBEN COUNTY
60.7 56.2 60.8
55.5
62.1 67.9 64.9
SUFFOLK COUNTY
60.8
SULLIVAN COUNTY
28.1 42.5
TIOGA COUNTY
71.7 67.5 55.1 61.6
TOMPKINS COUNTY
58.3
ULSTER COUNTY
53.4 57.4
WARREN COUNTY
48.1
WASHINGTON COUNTY
WAYNE COUNTY
WESTCHESTER COUNTY
WYOMING COUNTY
53.6
YATES COUNTY
56.5
WAYNE COUNTY
68.2 67.9 62.1
WESTCHESTER COUNTY
WYOMING COUNTY
53.6 64.9 56.5
YATES COUNTY
46.2
Census percent response by county
Census percent response by county
2010 2020
ALBANY COUNTY
60.6
68.7 67.8
0 10 20 30 40 50 60 70
2010 2020
CATTARAUGUS COUNTY
48.2
45.9
57.4 53.8 63.9
63.9 64.1
CAYUGA COUNTY
53.8 53.9
45.9
49.9 5479.1.9
CHAUTAUQUA COUNTY
60.8
70.8
66.2 69.6 70.7
67
66.2 66.6 66.7
63.6 72.7
CHEMUNG COUNTY
CHENANGO COUNTY
50 50.4
58.1 580.24
CLINTON COUNTY
COLUMBIA COUNTY
66.7 59.6 65.7
CORTLAND COUNTY
DELAWARE COUNTY
32.7 32.7
34.5
41
34.5
CAYUGA COUNTY
CHAUTAUQUA COUNTY
53.9
64.158.1
CHEMUNG COUNTY
70.8
CHENANGO COUNTY
50
CLINTON COUNTY
61.9
58.2 57.1
65.7
66.2 69.6
COLUMBIA COUNTY
CORTLAND COUNTY
66.7
DELAWARE COUNTY
32.7 32.7
HAMILTON COUNTY 7.2 HERKIMER COUNTY
HERKIMER COUNTY
49
59.1 60.8
66.2
JEFFERSON COUNTY
LIVINGSTON COUNTY
66.6
MADISON COUNTY
66.7
MONROE COUNTY
MONTGOMERY COUNTY
52.8 53.4
67.3 70.4 67.3 70.4 66.2
JEFFERSON COUNTY
41
KINGS COUNTY (BROOKLYN)
49.1
60.8
KINGS COUNTY (BROOKLYN)
49.1
LEWIS COUNTY
34.5
LEWIS COUNTY
LIVINGSTON COUNTY
58.9
MADISON COUNTY
58.9 59.4
52.8 63.6 58.5 58.5
MONROE COUNTY
72.7
MONTGOMERY COUNTY
59.4
July-August 2020
The Work Force 5
RICHM
0 10 20 30 40 50 60 70 80
80
